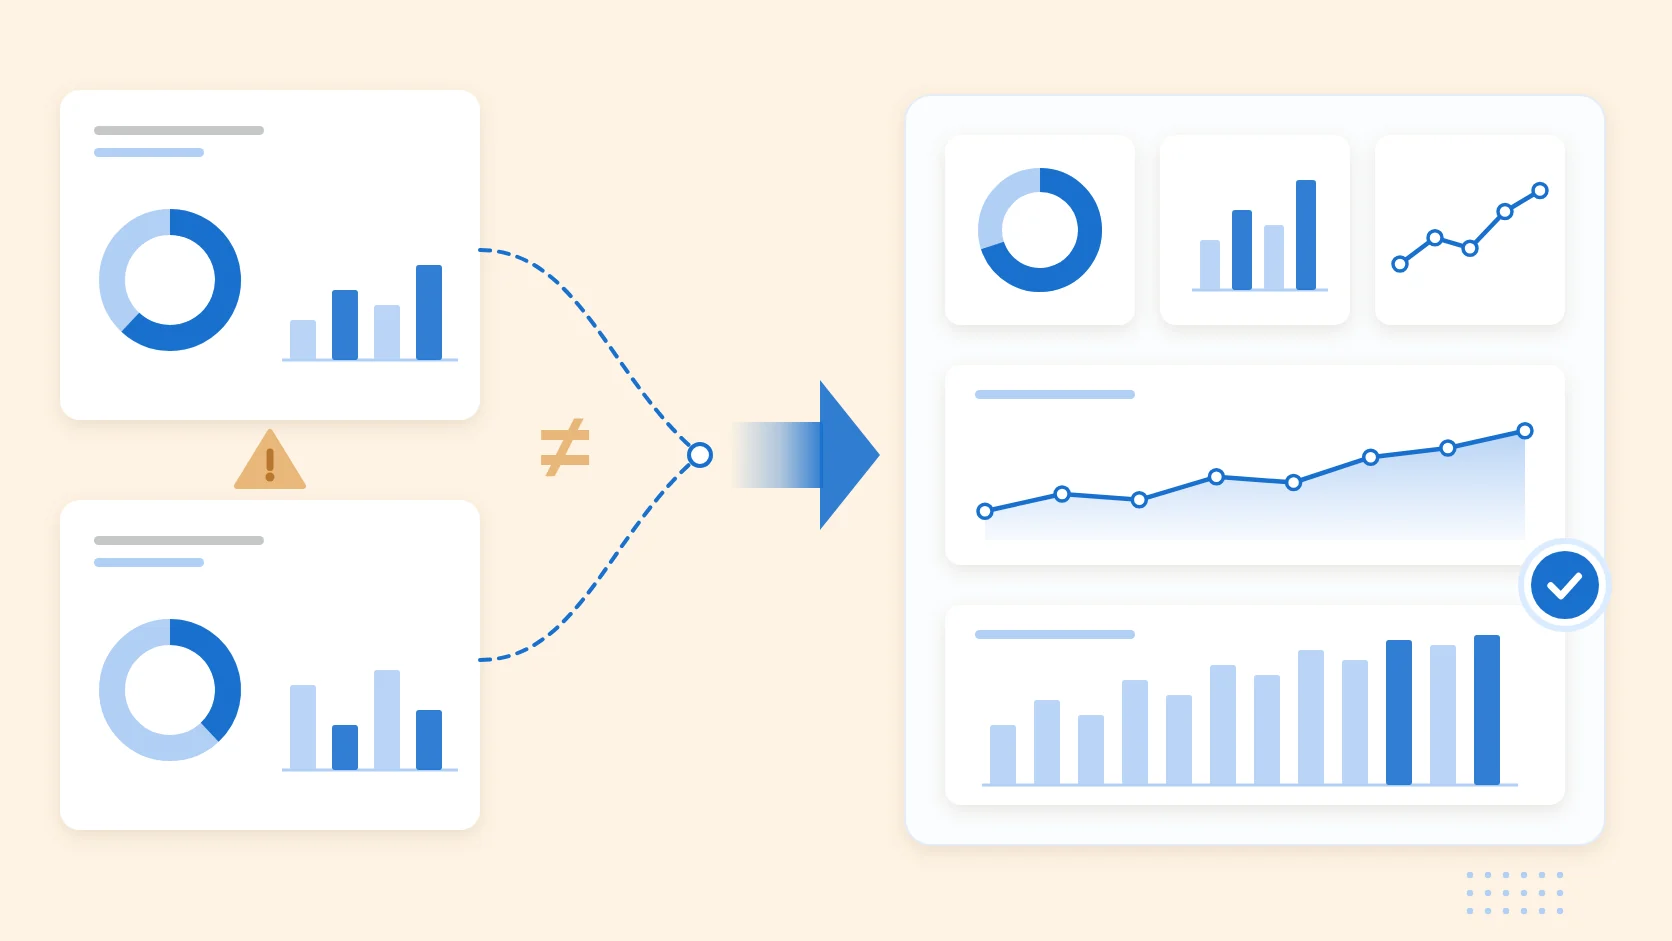
Every MGA has lived this meeting: the dashboard says the program’s loss ratio is one number, the monthly report says another, and the carrier partner is looking at a third. Nobody is lying. The numbers come from different extracts, filtered differently, defined differently, and refreshed on different schedules. Reporting you can trust is not a visualization problem; it is an architecture problem, and it is solved where the data lives. On an AI-native core like Viola by RegenAI InsurTech, reporting is not a system beside the platform; it is a read of the same records that quoting, policy administration, claims, and payments write, which is the only arrangement in which the dashboard and the books can agree by construction.
Why insurance reporting drifts from the truth
The standard reporting stack starts honest and decays predictably:
Every extract is a fork. The moment policy data is copied into a warehouse for reporting, there are two versions of the book, and they diverge with every mid-term endorsement, cancellation, and late-posted payment.
Definitions multiply. Is an “open claim” one not yet closed, or one with activity in thirty days? Is earned premium computed daily or monthly? Each report writer answers privately, and each answer is defensible, which is exactly the problem: defensible disagreement.
Configured inputs masquerade as measurements. Expense ratios, development factors, and allocations often enter as assumptions. Nothing wrong with that, until the dashboard presents them with the same confidence as counted premium.
Small books lie smoothly. A loss ratio computed on a thin state or a young cohort looks precise and means little. Reporting that does not know its own credibility limits invites decisions on noise.
What reporting looks like on one core
Viola’s reporting is built as a first-class part of the platform rather than an export from it, and the design choices are the argument:
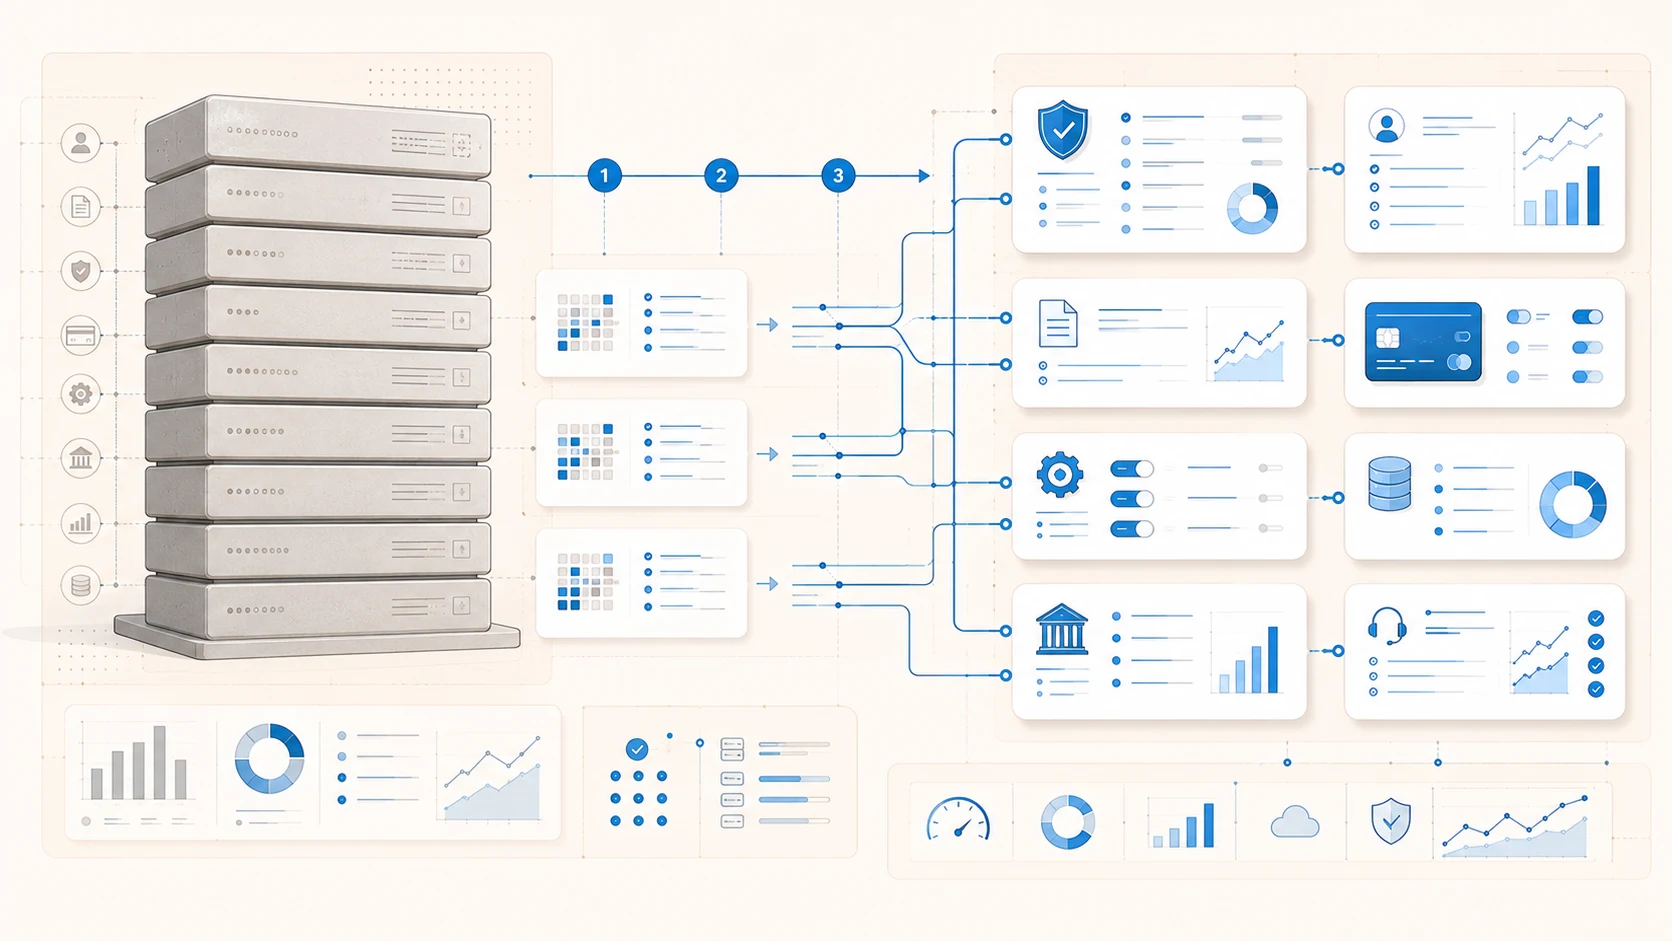
- One source, no extracts. Executive and operations dashboards read the same live records the workflows write, over real-time channels; there is no nightly copy to drift.
- Business definitions live in one place. Loss ratio, earned premium, claim status, quote-to-bind: each is defined once, in the data layer itself, so every surface that shows a number computes it the same way. When a definition has to change, it changes everywhere at once, visibly.
- Reconciliation is tested, not assumed. The platform ships with an automated reconciliation suite proving that dashboard numbers equal report numbers. Agreement between surfaces is a test that runs, not a hope that holds.
- Configured inputs are labeled. Where a metric depends on an assumption, the combined ratio’s expense component, for example, the tile says so. An executive should always know which numbers were counted and which were configured.
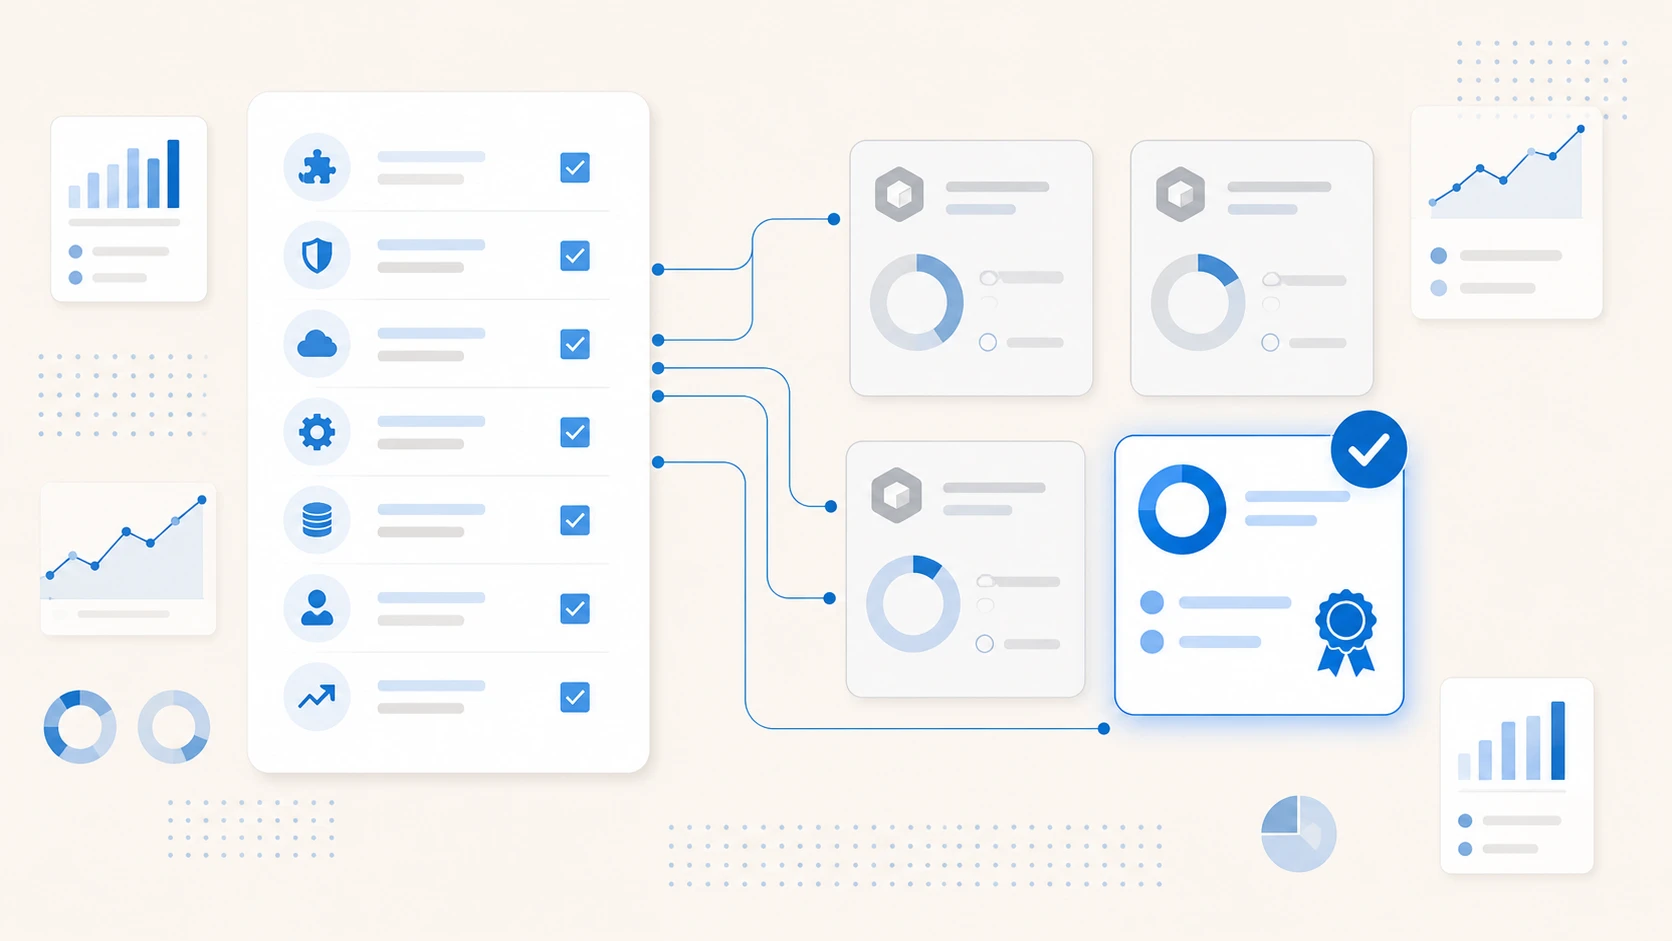
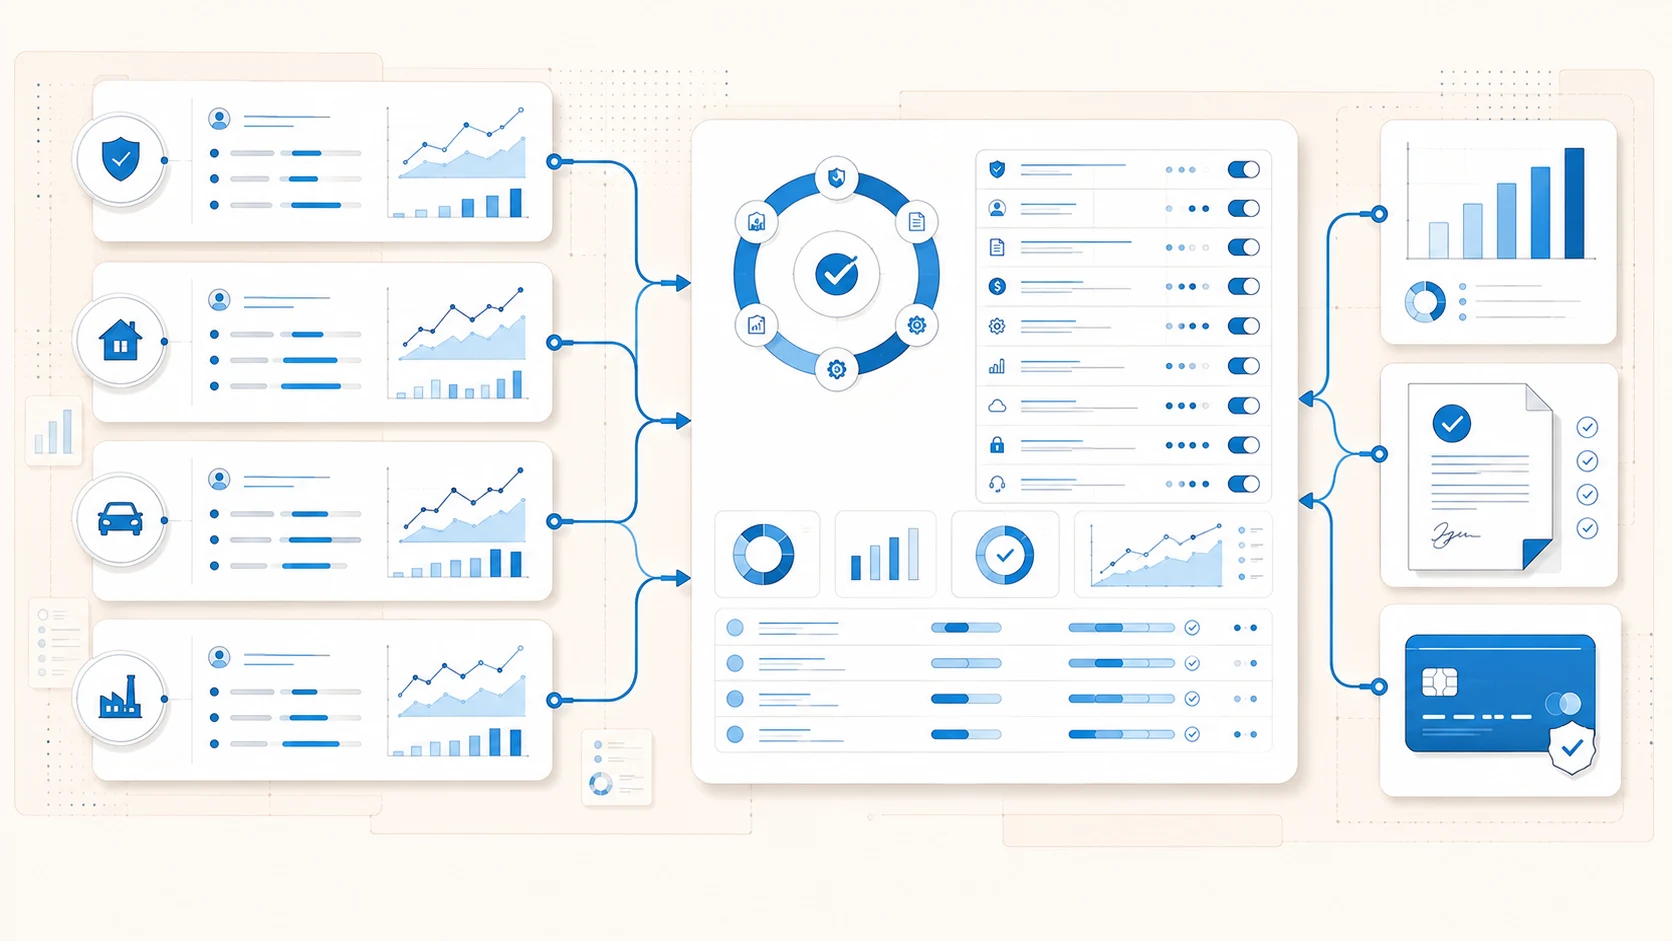
- The metrics are the ones the business runs on. The executive view carries gross written premium, policies in force, loss and combined ratios, quote-to-bind conversion, written premium trend split new versus renewal, loss ratio by state, and production by channel. The operations view carries the claims floor: filed, open, and closed counts, average cycle time, frequency per hundred policies in force, breakdowns by status, severity, and type, reserves and estimated exposure, and adjuster workload. Every tile traces to a real field; none is a mock-up waiting for data.
What this changes for an MGA or program administrator
Carrier conversations change first. A program administrator whose numbers reconcile can hand a carrier partner the same figures the internal team runs on, with definitions attached. Trust in the numbers is trust in the operation; it shows up at renewal.
Problems surface while they are cheap. Loss ratio by state and claims frequency by cohort, read from live data, turn a deteriorating segment into a this-month conversation instead of a year-end surprise.
The reporting team stops being a factory. When the routine numbers assemble themselves and export cleanly, the analysts who produced them become the people who interpret them, which is what they were hired for.
Questions that expose untrustworthy reporting
- “Show me the same metric on two surfaces.” Ask for the loss ratio on the dashboard and in the exported report, computed now. If the vendor hesitates, the surfaces disagree.
- “Where is earned premium defined?” One authoritative definition is an answer; “each report defines it” is a confession.
- “Which of these numbers are configured?” A vendor who cannot point to the assumed inputs is presenting assumptions as measurements.
- “What happens on a thin segment?” Good reporting acknowledges credibility limits instead of rendering noise with confidence.
Scope note for evaluators: Viola runs personal auto today, multi-line by design, and its reporting depth follows the book it runs: the state, channel, and claims-cycle views are production paths, while multi-line consolidation arrives with the lines themselves.
A book of business is a set of promises accumulating quietly. Reporting is how an operator listens to it. The test of a platform is not how beautiful the charts are; it is whether, when the carrier calls, everyone in the conversation is reading the same truth.